
Overview
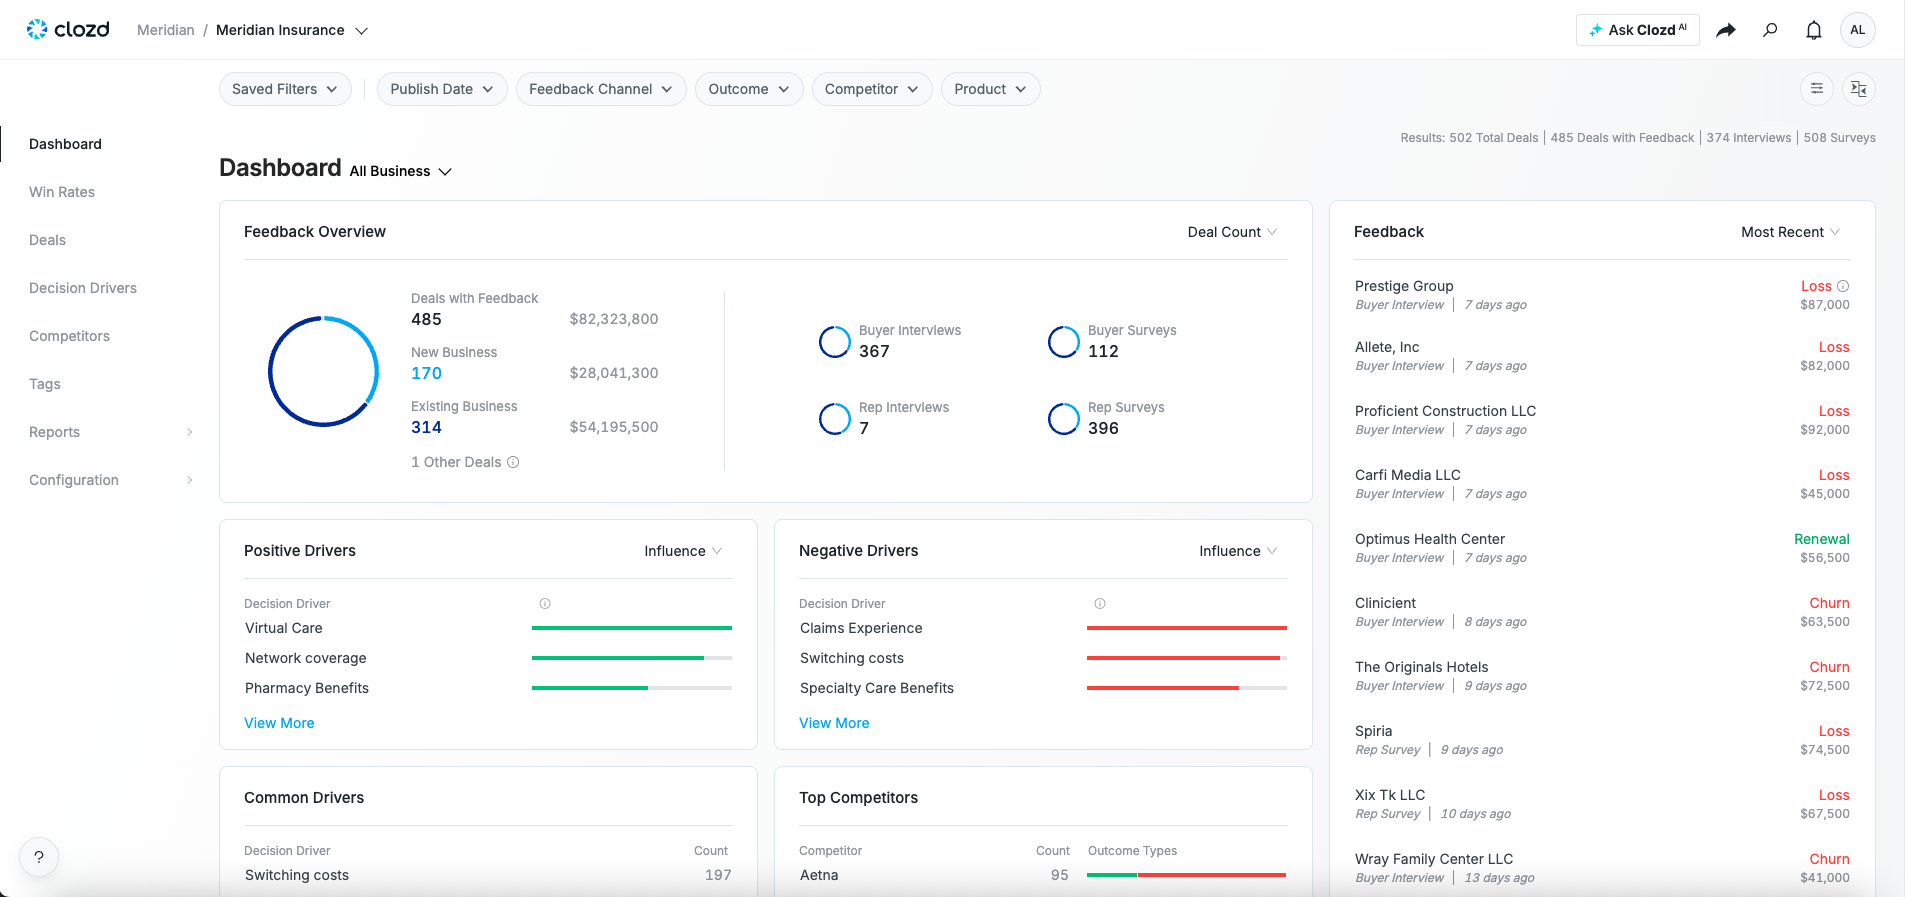
The first thing you’ll see when you open a program in the Clozd Platform is the Dashboard. It gives you an overview of your win-loss program as well as smaller widgets that provide more specific insights. These tiles are all previews and can be clicked on to see more information.
This article contains the following sections:
- Dashboard Overview
- Feedback Overview
- Why We Win & Why We Lose
- Common Drivers
- Top Competitors
- Recent Feedback
Dashboard Overview
The dashboard is broken into several different sections. They are as follows:
- Feedback Overview
- Positive Drivers
- Negative Drivers
- Common Drivers
- Top Competitors
- Feedback
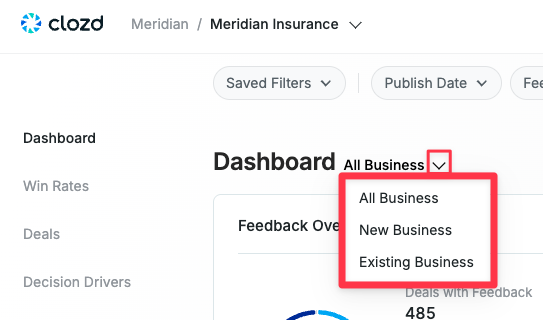
It's important to know which dashboard you're viewing. You can filter the data by selecting All Business, New Business, or Existing Business. You can select the one you want by clicking the dropdown to the right of Dashboard in the top-left corner of the page.
Feedback Overview
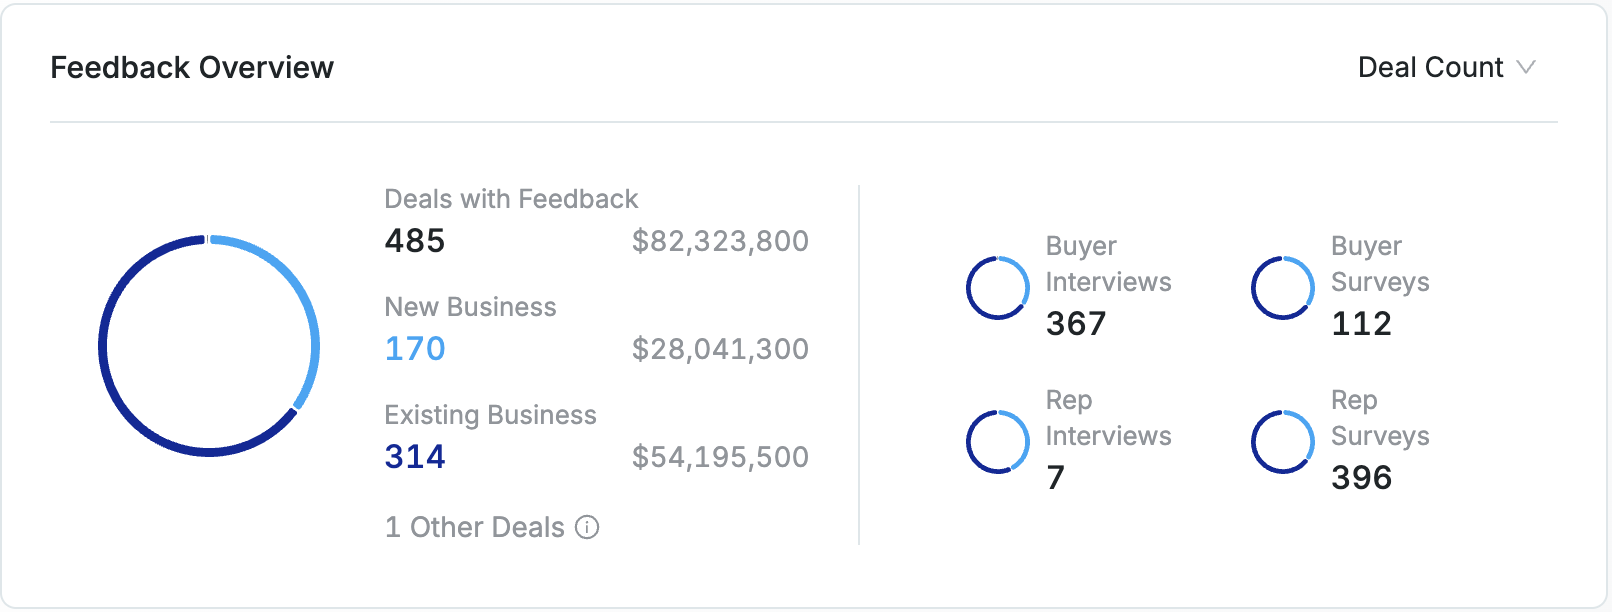
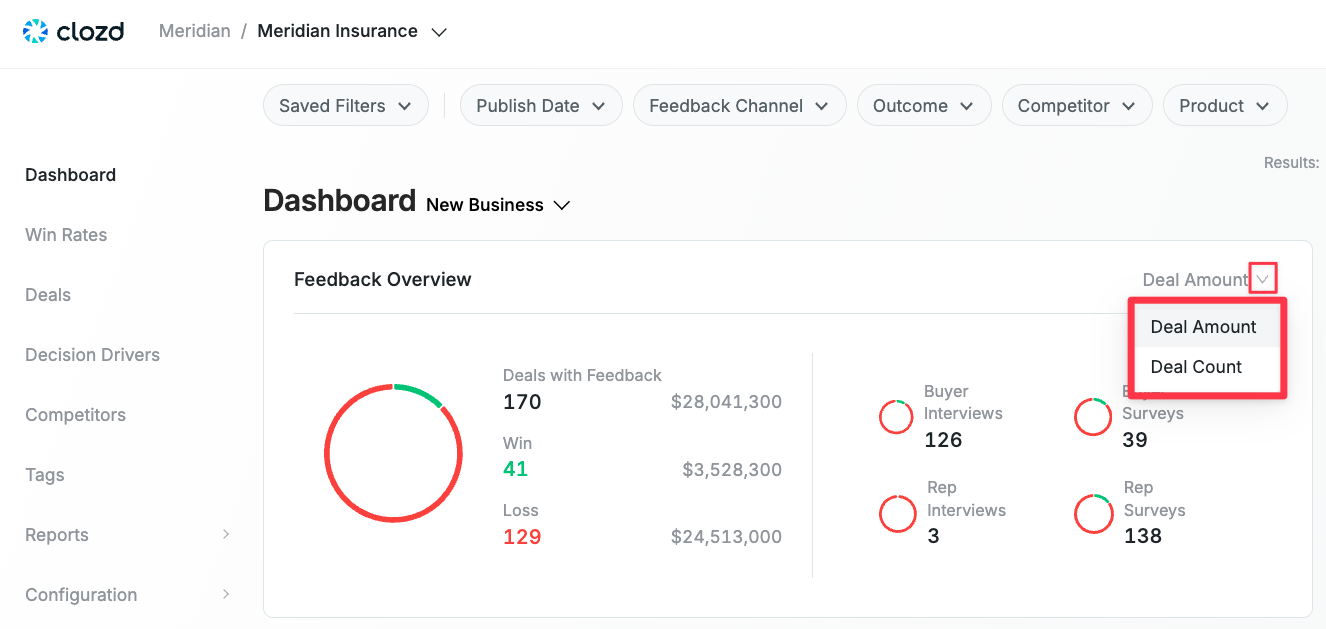
This widget shows information about your win-loss analysis sample. This breaks down deals you've received feedback for by outcome and channel.
The chart on the left shows feedback you've received by outcome. For instance, if you were only reaching out to closed-loss deals for interview and survey feedback, the entire donut chart would be red. You can also see the dollar amount associated with those deals along with feedback.
The right half of this widget shows how many pieces of feedback you've received from each of the four feedback channels (Buyer Interviews, Buyer Surveys, Rep Interviews, and Rep Surveys).
All Business
New and Existing Business
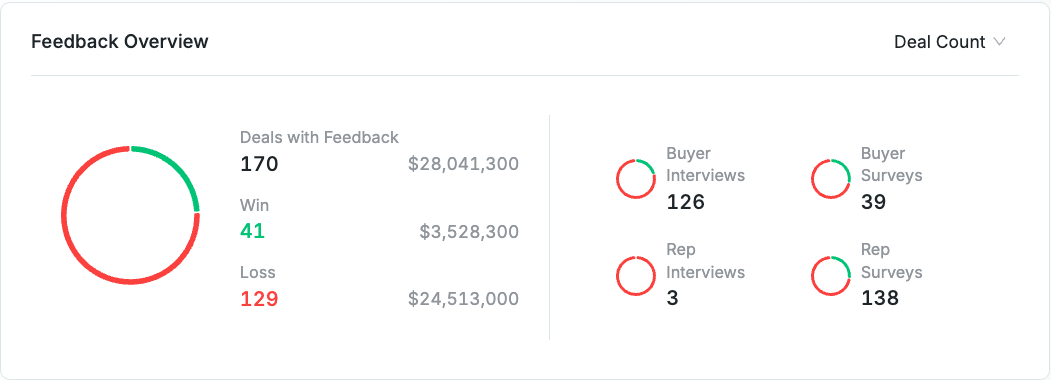
Whether it's All Business, New Business, or Existing Business, you can filter the Feedback Overview by either Deal Amount (the amount of money won or lost) or by Deal Count (the total number of deals won or lost).
Why We Win & Why We Lose
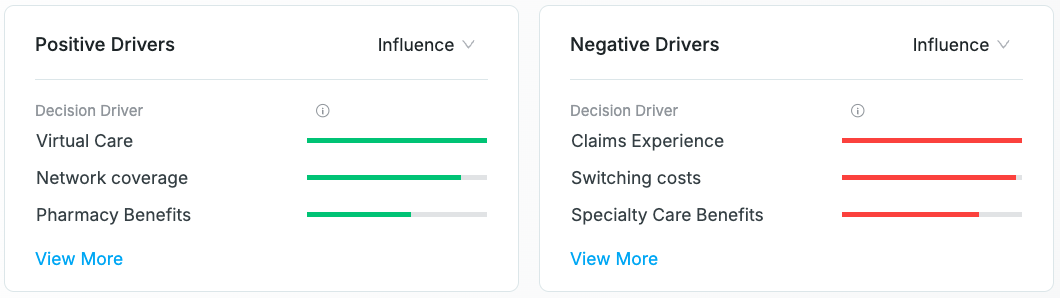
Beneath the Feedback Overview, you can see the top three reasons why you win and lose—we call these Decision Drivers. You can click on any of the listed Decision Drivers to see recent quotes associated with that driver. You can also select View All Decision Drivers to quickly navigate to the Decision Drivers tab.
Note:
If you're viewing All Business, these are called Positive Drivers and Negative Drivers.
If you're viewing New Business, these are called Win Drivers and Loss Drivers.
If you're viewing Existing Business, these are called Renewal Drivers and Churn Drivers.
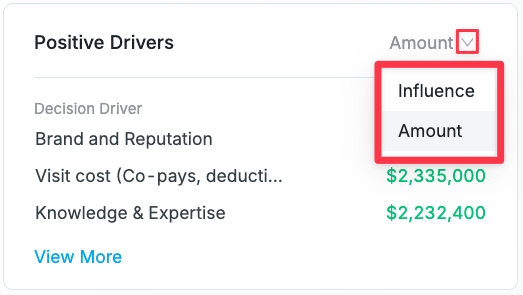
The Decision Drivers on the dashboard can be filtered by Influence (how much that driver affected the deal outcome) and Amount (how much money was won or lost due to that driver).
Common Drivers
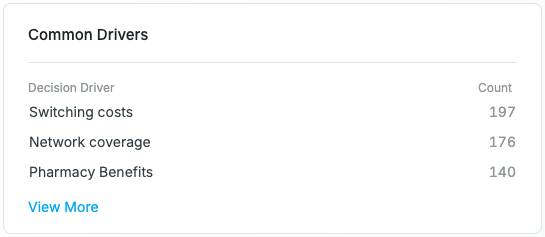
This widget shows the three most common Decision Drivers across your company. If you click View More, you'll be directed to the Decision Drivers page for more information on Decision Drivers.
Top Competitors
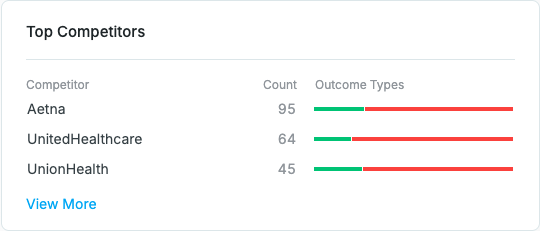
Here you can see your company’s top competitors, along with your corresponding win rate against them. Simply hover over any of the listed competitors to see a quick summary of your deals against that competitor—or click on View More to see a more comprehensive analysis in the Competitors tab.
Recent Feedback
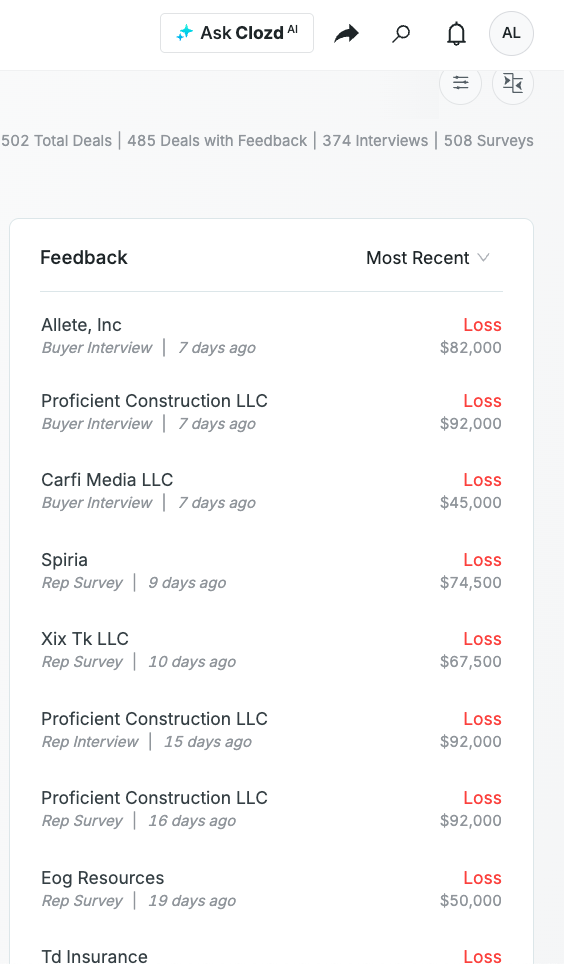
The next key component of the Dashboard is the Recent Feedback section. Here you can quickly open deals with recently published feedback. This includes interviews and surveys—from both buyers and sellers. Click on any of the listed deals to open up the Deal page and view the associated feedback.
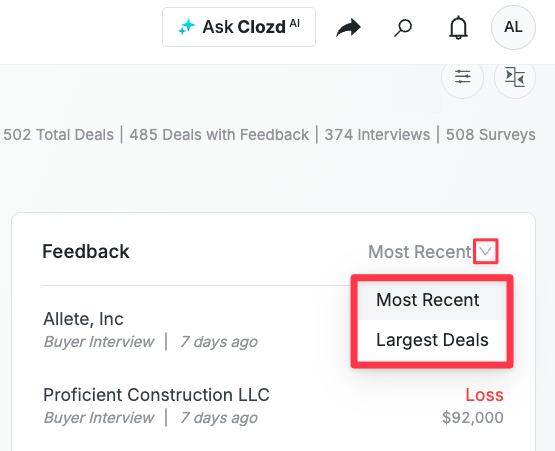
You can filter Feedback by Most Recent or Largest Deals.
Questions?
Please reach out to support@clozd.com if you have any additional questions.